Dandello's Garden
USDA Hardiness Zones
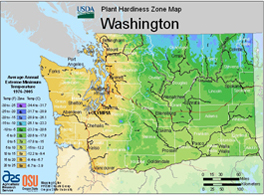
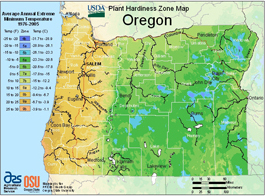
The most recent version of the USDA Hardiness zones has each zone broken into 'a' and 'b' sections, allowing for 5° increments. However, the overall map is based on average terrain - a site above average terrain may be in a different (colder) hardiness zone than a neighbor down the hill. Therefore, the hardiness zones should only be considered a guideline.
Keep in mind the hardiness zones refer to average winter temperatures. This does not take into account local wind chill factors or non-average cold snaps, ice storms, etc. The hardiness zones also do not take into account high summer temperatures. The Western Columbia Basin rarely reaches 100° in summer even though it shares the same hardiness zone with portions of Texas and Florida. (Although the temperature and rain patterns have been changing over the past several years.)
Consideration of the needs of cold intolerant plants can help them thrive in areas where they may not otherwise do well, provided their light and moisture needs are met. While severe cold can damage or kill many tender plants that are not protected, severe heat can also damage heat sensitive plants. Heat sensitive plants may need additional water, mulching, and maybe even shade cloth, to protect them during the hottest days in warmer climes.


Maps from USDA Plant Hardiness Zone Map
| USDA Zones | ||||||
|---|---|---|---|---|---|---|
| Zone | 4 | 5 | 6 | 7 | 8 | 9 |
| a | -30° to -25°F. | -20° to -15°F. | -10° to -5°F. | 0° to 5°F. | 10° to 15°F. | 20° to 25° F. |
| b | -25° to -20°F. | -15° to -10°F. | -5° to 0°F. | 5° to 10°F. | 15° to 20°F. | 25° + F. |